

When you hear or read that the market is up or down, what does that really mean? More often than not, it reflects movement in the two best-known stock market indexes, the Dow Jones Industrial Average and the S&P 500.
In fact, there are hundreds of indexes that track various categories of investments. While you cannot invest directly in an index, you can buy funds that track specific indexes, and you can look at indexes as a benchmark for certain portions of your portfolio. For example, the Dow or the S&P 500 might be a reasonable benchmark for your domestic stocks and stock funds, but you should not expect your entire portfolio to match the performance of those indexes.
Here are some commonly cited indexes.
The Dow Jones Industrial Average tracks stocks of 30 large well-known U.S. companies across a variety of business sectors. Originally a true average of stock prices, it now uses a divisor to adjust for stock splits, distributions, and substitutions — making it a price-weighted index rather than a true average.1
Unlike the Dow, the following indexes are weighted based on market capitalization, the value of a stock's outstanding shares. Market-cap-weighted indexes are skewed toward the performance of the larger companies in the index.
The S&P 500 tracks a much broader range of large U.S. companies (large caps) than the Dow and is often considered representative of the U.S. stock market in general. However, it does not capture mid-size companies (mid caps) or small companies (small caps), which generally carry higher risk and higher growth potential than large companies and are tracked by the S&P MidCap 400 and S&P SmallCap 600, respectively. Together these three indexes comprise the S&P Composite 1500. The number of stocks in S&P indexes may vary slightly from the number indicated in the name.2
The NASDAQ Composite Index tracks all domestic and foreign stocks traded on the Nasdaq Stock Market (about 3,400 in early 2024). It includes companies of all sizes across a range of industries but is heavily weighted toward technology companies. Many Nasdaq stocks carry higher growth potential but greater risk than the large domestic stocks tracked by the Dow and the S&P 500. The Nasdaq-100 tracks the largest non-financial companies traded on the Nasdaq.3
The Russell 3000 Index tracks stocks of the 3,000 largest U.S. companies, ranked by market capitalization. The Russell 1000 Index tracks about 1,000 of the largest, essentially a combination of large caps and mid caps. The Russell 2000 Index tracks the rest and is the most widely used benchmark for U.S. small-cap stocks.4
The FT Wilshire 5000 Index tracks the performance of all U.S. stocks with readily available price data, making it the broadest measure of the U.S. stock market. When established in 1974, the index contained around 4,700 stocks, and grew to more than 7,500 in 1998. The number has dropped since then, largely due to corporate consolidation, and the index included about 3,400 stocks in early 2024.5
The MSCI EAFE Index tracks about 800 large- and mid-cap stocks in 21 developed countries outside the United States and Canada and is a widely accepted benchmark for foreign stocks. The MSCI World Index includes the same 21 countries plus the U.S. and Canada and is heavily weighted toward U.S. stocks.6
Five Indexes, Five Years
Annual index performance (price only), 2019 to 2023
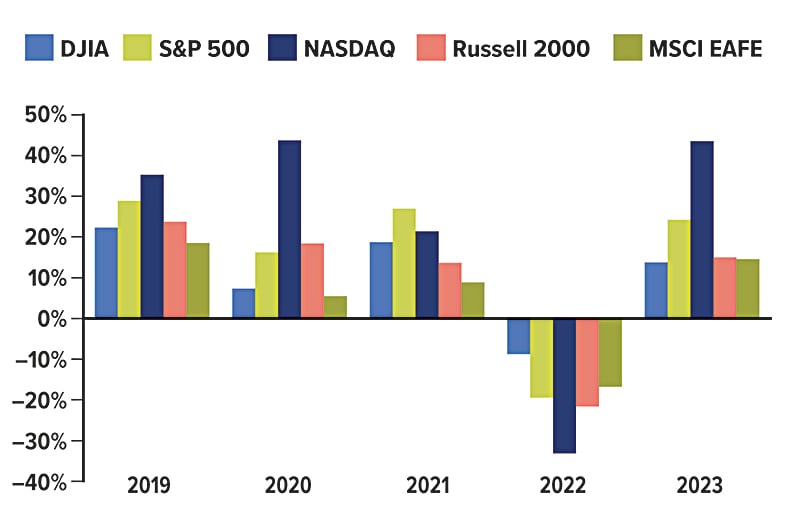
Source: London Stock Exchange Group, 2024, for the period 12/31/2018 to 12/31/2023. Dow Jones Industrial Average (DJIA) Price Index, S&P 500 Composite Price Index, NASDAQ Composite Index (price), Russell 2000 Price Index, and MSCI EAFE Price Index. The performance of an unmanaged index is not indicative of the performance of any specific security. Past performance is no guarantee of future results. Actual results will vary.
All investing involves risk, including the possible loss of principal, and there is no guarantee that any investment strategy will be successful. Investing internationally carries additional risks such as differences in financial reporting and currency exchange risk, as well as economic and political risk unique to the specific country. This may result in greater share price volatility.
Funds are sold by prospectus. Please consider the investment objectives, risks, charges, and expenses carefully before investing. The prospectus, which contains this and other information about the investment company, can be obtained from your financial professional. Be sure to read the prospectus carefully before deciding whether to invest.
1–2) S&P Dow Jones Indices, 2024; 3) Nasdaq, 2024; 4) FTSE Russell, 2024; 5) Wilshire, 2024; 6) MSCI, 2024
Prepared by Broadridge Investor Communication Solutions, Inc. Copyright 2024